
Module 0: Introduction to Systems Thinking – Lesson 4
This lesson is just one part in our series on Systems Thinking. Each lesson reads on its own, but builds on earlier lessons. An index of all previous lessons can be found at the bottom of this page.
“Systems thinking notation” refers to the visual languages and symbolic conventions people use to represent systems, their parts, and their behaviors. It’s the way systems thinkers draw and formalize systems so that others can understand structure and dynamics, rather than just descriptions in words.
There are two primary types of diagrams used to notate systems in concept:
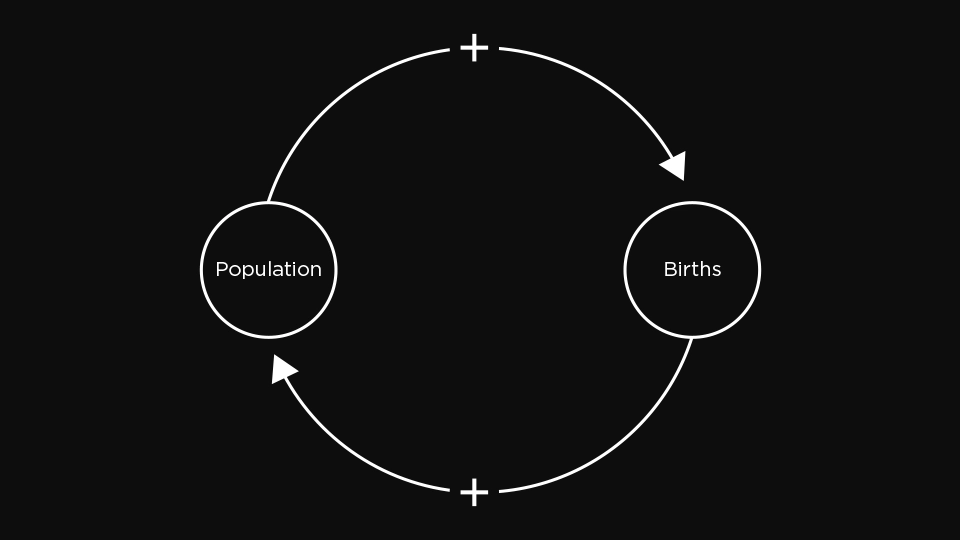
1. Causal Loop Diagrams (CLDs)
- Notation: Circles or variables connected by arrows. Arrows show cause-and-effect. A “+” or “–” sign at the arrowhead indicates whether the effect moves in the same or opposite direction.
- Usage: To highlight feedback loops (reinforcing or balancing).
- Example: Population growth → births → population growth (reinforcing loop).
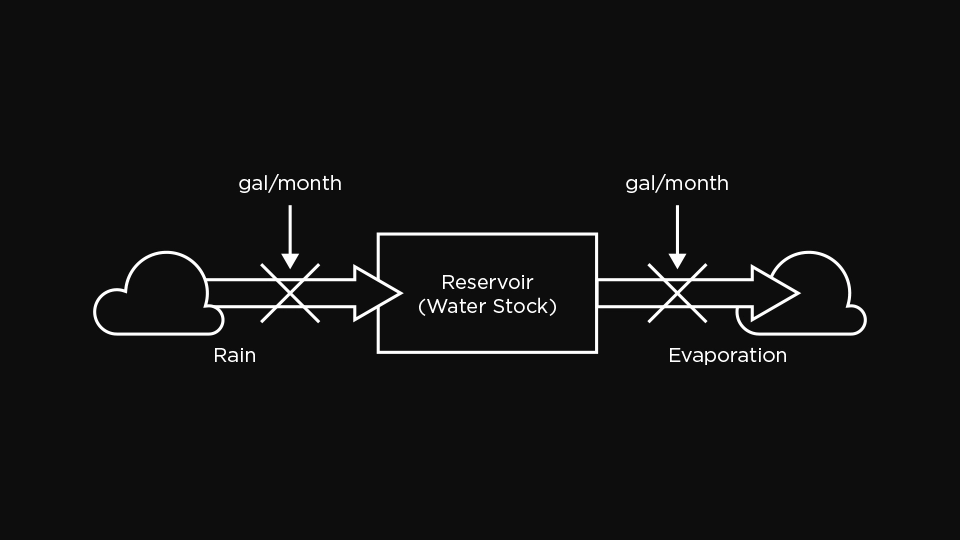
2. Stock and Flow Diagrams (SFDs)
- Notation: Boxes (stocks or accumulations), double-lined arrows with valves (flows), and single arrows (information links).
- Usage: To capture how things accumulate over time and how rates of inflow/outflow change.
- Example: Reservoir of water (stock) with inflow from rain and outflow through a dam.
Elements of a Stock and Flow Diagram
Stock
- Symbol: A box
- Definition: A stock is an accumulation that builds up or drains away over time. It can only change through flows.
- Notes: Think of it as a “level” at any moment, like water in a tank or money in an account.
Flow
- Symbol: A double lined arrow
- Definition: A flow is the movement that fills or empties a stock. Flows can be inflows (adding) or outflows (removing).
- Notes: Flows are measured over time (e.g., per day, per year).
Flow Rate
- Symbol: The label on a flow (with units of time)
- Definition: The speed at which a flow occurs, always expressed “per unit of time.”
- Examples:
- People per year (incidence rate)
- Dollars per month (revenue)
- Liters per minute (water flow)
Cloud
- Symbol: A cloud shape at the end of a flow
- Definition: Represents the boundary of the model — either an unlimited source or an unlimited sink.
- Notes: A source is where a flow originates (outside the system), and a sink is where it disappears. Clouds are assumed to have infinite capacity.
Link
- Symbol: A single line with an arrow
- Definition: A link shows an informational or causal dependency between elements.
- Notes: If one element is used in the equation for another, they must be connected with a link.
Why this?
As we progress, we’ll use simple notations to make system dynamics clearer and easier to visualize. Causal Loop Diagrams (CLDs) and Stock-and-Flow Diagrams (SFDs) are just the starting point — we’ll expand this toolkit as we go. By the end, you’ll be able to map and interpret complex systems with confidence, using the right notation to reveal how they really work.
Course Index
- Module 0: Introduction to Systems Thinking