
Module 2: Feedback Loops and Causality — Lesson 2
This lesson is one part of a series on Systems Thinking. Each lesson stands on its own, but builds on earlier ones. An index of all lessons appears at the bottom of this page.
What You’ll Learn
- Why systems rarely respond in proportion to the effort we apply
- How delays distort our perception of cause and effect — and how to account for them
- What non-linearity means in practice, and where it shows up in business and strategy
- How to use delays and non-linear patterns to act with better timing and leverage
Why Systems Surprise Us
Systems don’t respond on our schedule. That’s not a bug — it’s a defining feature.
When we act in a complex system, we expect a proportional reply: push harder, get more. But what we get instead is lag, then overshoot. Silence, then cascade. The system feels unresponsive until suddenly it isn’t, and we’re already past the point we were aiming for. These surprises aren’t random. They have structure. Two dynamics produce most of them: delays and non-linearity.
Delays stretch the gap between cause and effect, turning immediate actions into future consequences we won’t see for weeks, months, or years. Non-linearity bends the relationship between input and output, so that “more” sometimes means less, and “a little” sometimes triggers everything. Together, they explain why smart, well-intentioned decisions so often produce outcomes no one intended.
What Is a Delay in a System?
A delay in systems thinking is the lag between an action and its visible effect. Understanding delays is fundamental to avoiding the overshoot-and-collapse patterns that trap organizations, markets, and individuals in cycles of overcorrection.
Delays fall into two categories. Material delays are physical and structural: crops take months to grow, hiring takes quarters to affect output, and brand awareness takes years to convert into market position. Informational delays are perceptual: a market shift may be months underway before it shows up in data, and a cultural change may be well established before anyone names it.
The trap delays set is consistent. When we don’t see a response, we assume our action wasn’t enough and apply more. Then the delayed effect arrives — and it arrives on top of the addition we just made. The classic case is the thermostat: turn it up too aggressively on a slow-heating system and you end up sweltering, because the heat you ordered ten minutes ago is still arriving. The same overshoot pattern appears in hiring cycles, housing markets, supply chains, and pharmaceutical dosing. The system wasn’t broken. The feedback was just slow, and we didn’t account for it.
As a general rule, when a system seems unresponsive, assume a delay is present before assuming the intervention failed.
What Is Non-linearity, and Why Does It Matter?
Non-linearity describes any relationship where input and output don’t scale proportionally. The most reliable approach to spotting non-linearity is to ask: “If I doubled my effort here, would I expect double the result?” If the honest answer is no, you’re in non-linear territory.
This matters because our intuition defaults to linear thinking. We extrapolate from the recent past and expect the curve to continue. But most systems don’t curve that way for long. They have thresholds — points below which nothing seems to happen, and above which everything changes at once. They have diminishing returns — where early gains come easily but each additional unit of effort yields progressively less. And they have runaway dynamics — compounding effects that accelerate far past any linear forecast.
Systems thinkers often describe behavior over time using S-curves. Growth is slow at first, then accelerates rapidly after a tipping point, then flattens as the system approaches its limits. Missing any of these three phases — especially the transition between them — leads to misallocated effort, missed windows, and decisions calibrated for the wrong part of the curve.
The most common mistake in non-linear systems is applying a linear strategy: more effort, more resources, more time — when the real question is whether you’re on the right part of the curve at all.
How to Recognize Delays and Non-linearity in Practice
Recognizing these dynamics doesn’t require models or data sets. It requires a different set of questions.
For delays, ask: When does the effect of this action actually arrive? If the answer isn’t “immediately,” a delay is present and needs to be named. Ask how long the lag typically runs. Ask whether your decision-making cycle is shorter than that lag — because if it is, you will almost certainly overcorrect.
For non-linearity, ask: Does twice the input yield twice the output here? If not, where does the curve bend? Look for thresholds — points where the system changes behavior qualitatively, not just quantitatively. Look for limits — ceilings that constrain growth and floors that prevent full collapse. Watch for oscillations, which are the behavioral signature of a delayed feedback loop that keeps triggering overcorrection.
These questions are diagnostic. They bring structure into view before it becomes a crisis. Systems thinking doesn’t require perfect prediction — it requires better anticipation.
Real-World Applications
Climate Change
The delay built into Earth’s climate system is one of the most consequential in human history. Carbon dioxide emitted today will continue trapping heat for decades. The warming we experience now reflects decisions made a generation ago. This is a pure material delay operating at civilizational scale. Non-linear tipping points amplify the risk: if polar ice collapses, it accelerates warming in ways that no longer respond proportionally to emissions reductions. Waiting for visible effects before acting means you’re already locked into decades of further consequence.
Supply Chain Disruptions
When demand spikes, manufacturers order more. The orders travel through a supply chain with layered delays — production lead times, shipping windows, customs processing. By the time the inventory arrives, demand has often shifted again. Each actor in the chain, responding to their own delayed signal, tends to over-order “just in case.” The result is the bullwhip effect: small demand fluctuations at the consumer end produce massive inventory swings upstream. Both delay and non-linearity are operating simultaneously. Addressing one without the other changes the amplitude but not the pattern.
Brand-Building and Advertising Spend
A new brand invests heavily in advertising. Sales don’t respond. Management either panics and cuts the budget, or doubles down without changing the strategy. What they’re missing is the delay: awareness builds before trust builds, and trust builds before purchase behavior shifts. That sequence takes months. They’re also missing the non-linearity: early ad spend produces steep awareness gains, but as audiences saturate, each additional dollar produces progressively less. Brands that understand this dynamic don’t chase quarterly signals. They sustain the strategy long enough for the delay to resolve, then reassess where they are on the diminishing-returns curve.
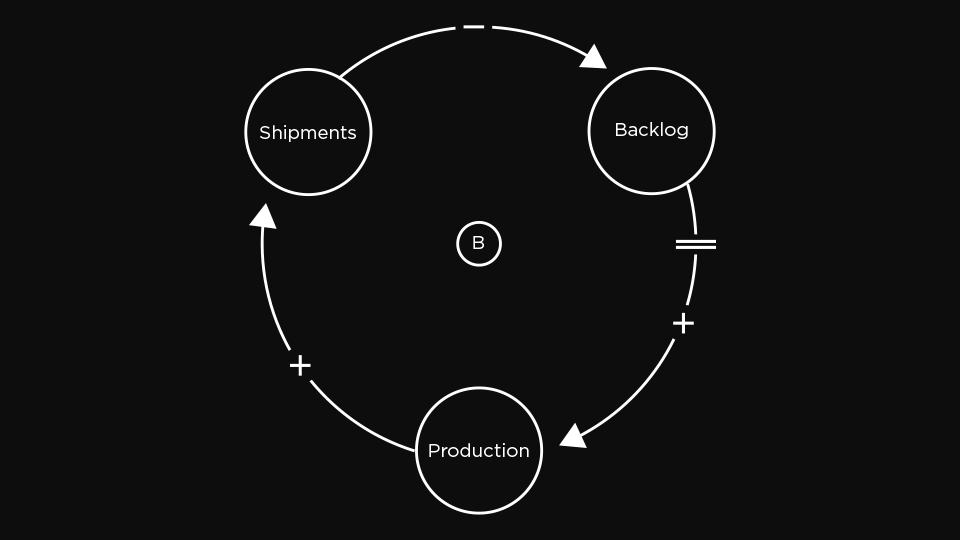
Notation: Marking Delays and Non-linearity in Diagrams
In causal loop diagrams (CLDs), a delay is marked with a double slash (//) on the arrow connecting cause to effect. This notation is a reminder: don’t treat this link as instantaneous. When you draw the delay, you commit to accounting for it.
Non-linear relationships are harder to capture in a single symbol. Common practice is to annotate the arrow — “(diminishing returns)” or “(threshold effect)” — or to sketch the curve shape alongside the diagram. The goal isn’t mathematical precision. It’s disciplined attention: naming the shape of the relationship keeps it visible and forces it into the analysis.
Thinking in Time and Curves
Delays and non-linearity are why systems so reliably defy our expectations.
They demand a different kind of thinking — not in snapshots but in rhythms, not in straight lines but in curves. When you develop the habit of asking “what’s the delay?” and “what’s the shape of this curve?”, you stop expecting instant payoff and stop making the overcorrection that instant expectation produces. You begin to see the arc before it arrives.
Delays teach us to respect timing. Non-linearity teaches us to respect proportion. Together, they give a more honest map of how systems move — and where to intervene wisely.
Course Index
- Module 0: Introduction to Systems Thinking
- Module 1: Components of Systems
- Module 2: Feedback Loops and Causality
- Module 3: Mental Models and Paradigms
- Module 4: Leverage Points and Change
- Module 5: Systems Archetypes
- Module 6: Applying Systems Thinking to Your World