
Module 0: Introduction to Systems Thinking – Lesson 4
This lesson is just one part in our series on Systems Thinking. Each lesson reads on its own, but builds on earlier lessons. An index of all previous lessons can be found at the bottom of this page.
Systems thinking notation is the set of visual languages and symbolic conventions used to represent systems, their components, and their behaviors. Where words describe a system, notation draws it — making structure visible and dynamics legible in ways that prose alone cannot. Two diagram types form the foundation of this visual language: Causal Loop Diagrams and Stock and Flow Diagrams.
What Is Systems Thinking Notation?
Systems thinking notation refers to the standardized visual tools used to map how systems behave over time. Rather than describing cause and effect in words, notation externalizes the structure of a system — making feedback loops, accumulations, and causal dependencies visible at a glance. As a general rule, the diagram type you choose depends on what aspect of the system you need to understand: relationships and feedback, or accumulation and flow.
The two most widely used notation systems are Causal Loop Diagrams (CLDs) for mapping feedback relationships, and Stock and Flow Diagrams (SFDs) for modeling how quantities accumulate and change over time.
What Are Causal Loop Diagrams?
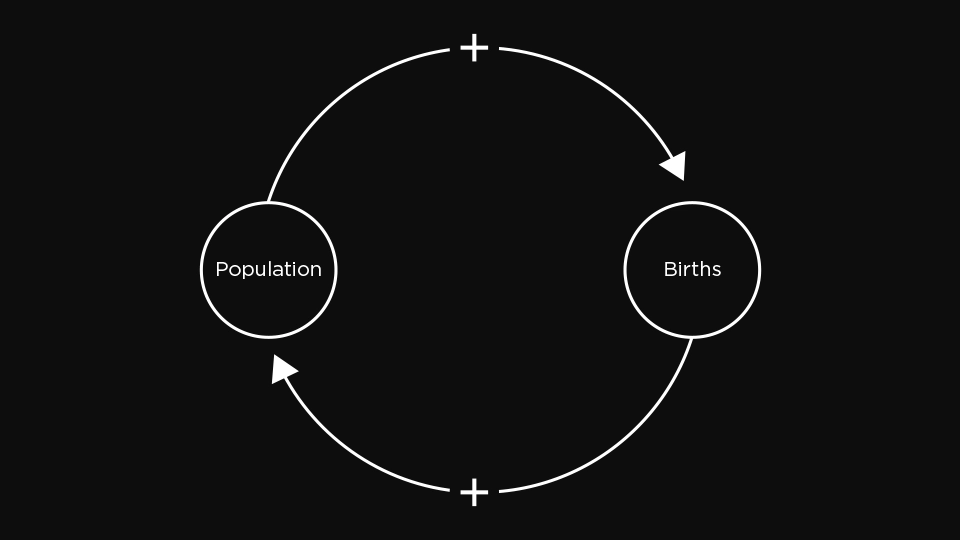
A Causal Loop Diagram (CLD) uses variables connected by arrows to represent cause-and-effect relationships within a system. Each arrow carries a polarity sign: “+” means the effect moves in the same direction as the cause, “–” means it moves in the opposite direction. When you trace a series of arrows back to their starting point, you have identified a feedback loop — the basic engine of all system behavior.
CLDs are the right tool when your goal is to understand why a system behaves the way it does. They make feedback loops visible. A reinforcing loop amplifies change in one direction; a balancing loop resists it. Population growth is the canonical example: more people → more births → more people. The loop is reinforcing, and once drawn, the dynamics become clear in a way they rarely are from description alone.
The most reliable approach is to begin any system analysis with a CLD. Map the relationships first. Once you understand the feedback structure, you can decide whether a more detailed Stock and Flow model is needed.
What Are Stock and Flow Diagrams?
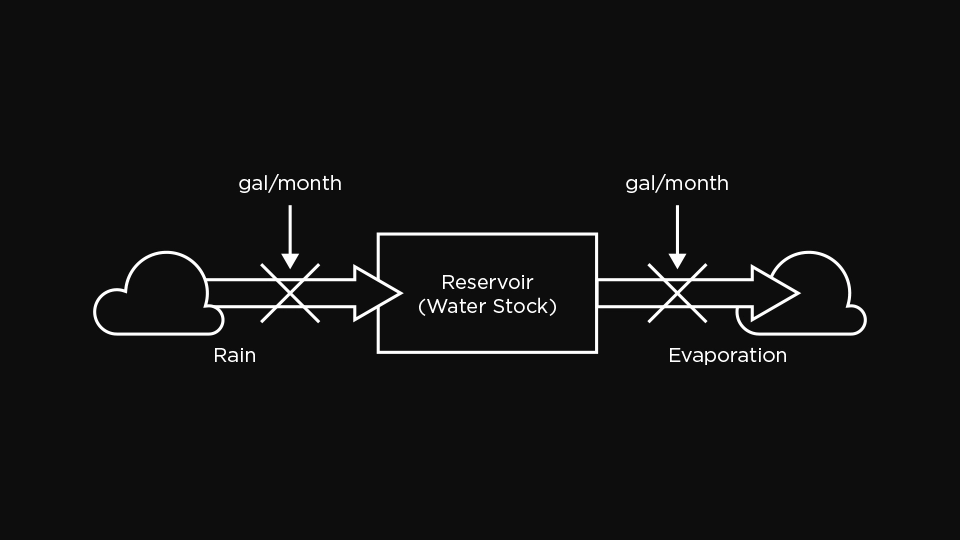
A Stock and Flow Diagram (SFD) uses three core elements — stocks (boxes), flows (double-lined arrows with valves), and links (single arrows) — to model how quantities accumulate and change over time. Where a CLD shows why a system behaves as it does, an SFD shows how much and how fast. The reservoir analogy is standard: a stock of water fills through rainfall (inflow) and drains through a dam (outflow). The stock’s level at any moment depends entirely on the history of those flows.
SFDs are the right tool when you need to track quantities over time — money in an account, people in a population, units in inventory. They make the distinction between a level (what exists at a point in time) and a rate (what changes it) explicit and precise.
The Elements of a Stock and Flow Diagram
Each element in an SFD has a specific role. Understanding them precisely matters, because ambiguity in notation produces ambiguity in analysis.
Stock is represented by a box. A stock is an accumulation that builds up or drains away over time, and it can only change through flows. Think of it as the level at any given moment: water in a tank, money in an account, trust in a relationship.
Flow is represented by a double-lined arrow. A flow is the movement that fills or empties a stock — either an inflow (adding) or an outflow (removing). Flows are always measured per unit of time: people per year, dollars per month, liters per minute.
Flow Rate is the label on a flow. It specifies the speed at which a flow occurs, always expressed as a quantity per unit of time. Getting the units right is not optional. A mismatch in flow rate units is one of the most common errors in system modeling, and it produces results that are numerically tidy and conceptually wrong.
Cloud is the cloud shape at the end of a flow. It represents the boundary of the model: an unlimited source (where inflows originate) or an unlimited sink (where outflows disappear). Clouds carry assumed infinite capacity. They mark what the model treats as outside its scope.
Link is a single arrow between elements. A link shows an informational or causal dependency — if one element’s value enters the equation for another, they must be connected. Links are how information moves through a structure without physically flowing.
Why Notation Matters
Notation is not administrative. It is cognitive infrastructure.
The discipline of drawing a system forces a precision that verbal description rarely demands. You cannot have a vague arrow the way you can have a vague sentence. Every element must be named. Every relationship must be directional. Every boundary must be declared.
As this series progresses, CLDs and SFDs will become the primary tools for making system dynamics visible and testable. They are the starting point. The goal is to reach a point where you can read a diagram and understand not just what a system does, but why it does it — and under what conditions it would do something different.
Course Index
- Module 0: Introduction to Systems Thinking
- Module 1: Components of Systems
- Module 2: Feedback Loops and Causality
- Module 3: Mental Models and Paradigms
- Module 4: Leverage Points and Change
- Module 5: Systems Archetypes
- Module 6: Applying Systems Thinking to Your World